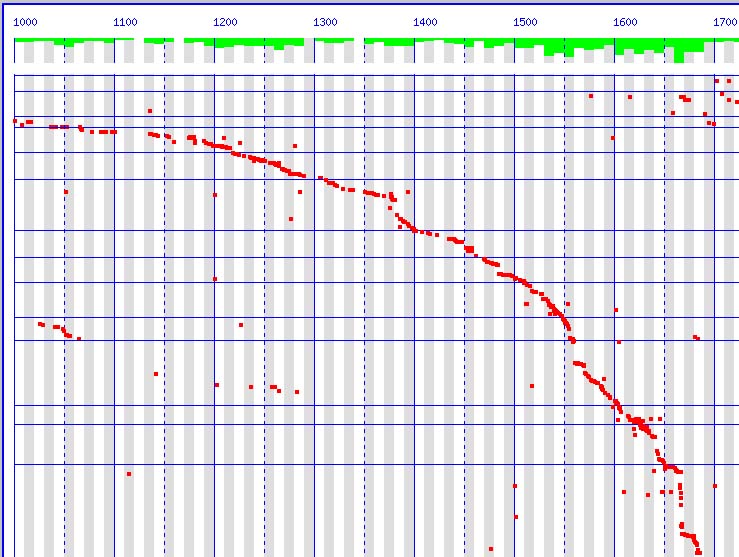
Figure 8: TIMELINE 1 shows the date chart for a the first volume of Allen's history: a reader can see at a glance that this volume moves chronologically through the history of London, while the increasing slope of the curve demonstrates the fact that the author increases his coverage as he moves forward in time.